Analyze Cape Cod real estate investment potential with 5-year appreciation data, rental income projections by town, tax considerations, and ROI analysis. Learn which Cape Cod towns offer the best investment opportunities.
Is Cape Cod a good investment? The data tells a compelling story: Cape Cod real estate has delivered consistent appreciation, outperforming many national markets while offering substantial rental income potential. With median home prices rising from $433,000 in 2019 to $739,000 in 2025, representing a 70.7% increase over six years, Cape Cod has proven resilient through economic uncertainty while maintaining strong fundamentals.
This comprehensive guide examines Cape Cod investment property performance, analyzing appreciation rates by town, rental income potential, tax advantages, and the key factors that make the Cape a compelling destination for real estate investors seeking both capital appreciation and cash flow.
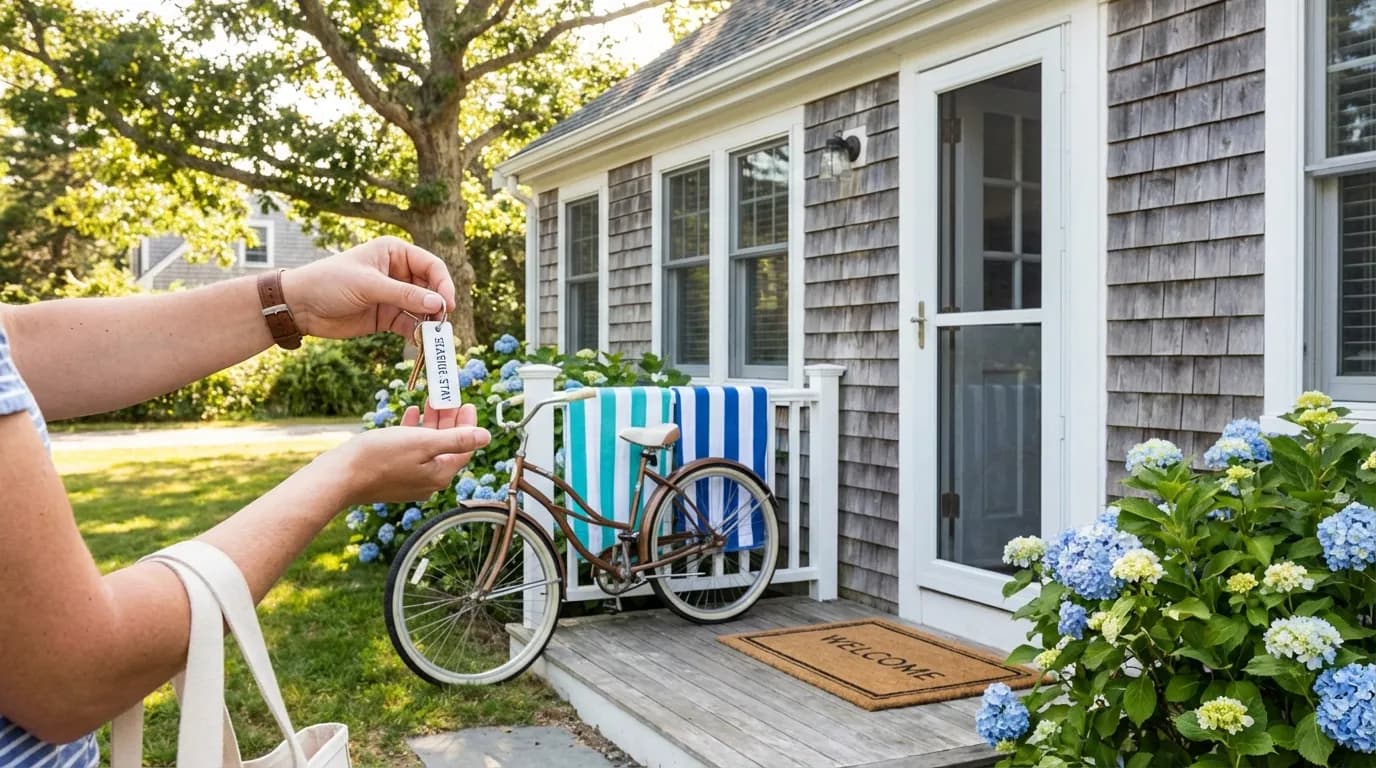
For detailed rental income analysis including regulations and operating costs, see our companion Cape Cod vacation rental income guide.
Cape Cod Market Performance: 5-Year Analysis
Cape Cod's real estate market has demonstrated remarkable strength over the past five years, characterized by steady price appreciation, low inventory, and sustained buyer demand.
Price Appreciation Trends (2021-2025)
The Cape Cod market has delivered consistent gains:
| Year | Median Price | Average Price | YoY Change |
|---|---|---|---|
| 2021 | $570,000 | $786,000 | - |
| 2022 | $640,000 | $872,000 | +12.3% |
| 2023 | $695,000 | $936,000 | +8.6% |
| 2024 | $715,000 | $981,000 | +2.9% |
| 2025 | $739,000 | $1,025,328 | +3.4% |
The five-year appreciation totals 29.6% for median prices and 30.5% for average prices. While the pace has moderated from pandemic-era peaks, annual appreciation remains positive, reflecting a market transitioning from explosive growth to sustainable gains.
Market Health Indicators
2025 key metrics reveal a balanced but competitive market:
- Months of Supply: 2.0 months (down 13% from 2024)
- Days on Market: 51 days (up from 36 days in 2021)
- Percent of List Price Received: 95.2% (down from 100.7% in 2021)
- Closed Sales: Down 1.7% year-over-year
These indicators suggest a market that remains favorable for sellers while offering buyers more negotiating leverage than during the pandemic frenzy. The increase in days on market and slight decrease in list-to-sale price ratio indicate a healthier, more sustainable market environment.
Longer-Term Appreciation Context
Extending the analysis further back demonstrates Cape Cod's impressive long-term performance:
- 2019 Median Price: $433,000
- 2025 Median Price: $739,000
- 6-Year Appreciation: 70.7%
- Compound Annual Growth Rate: 9.3%
This consistent appreciation reflects fundamental supply-demand dynamics: Cape Cod's geography limits developable land, environmental regulations restrict new construction, and demand from both primary residents and second-home buyers remains robust.
Appreciation Rates by Town
Cape Cod's 15 towns demonstrate significant variation in both price levels and appreciation patterns. Understanding these differences is essential for investment strategy.
Premium Markets: Highest Median Prices
The Outer Cape and select Lower Cape towns command the highest prices:
| Town | 2025 Median Price | YoY Change | 5-Year Appreciation |
|---|---|---|---|
| Provincetown | $2,150,000 | +10.7% | +62% |
| Chatham | $1,500,000 | +25.0% | +85% |
| Truro | $1,162,500 | -29.5% | +71% |
| Wellfleet | $937,500 | +1.4% | +58% |
| Orleans | $1,050,000 | +7.3% | +64% |
Chatham's exceptional 25% year-over-year increase in 2025 reflects extremely limited inventory combined with strong demand for its village charm and waterfront access. Provincetown's single-family median of $2.15M reflects the premium for detached homes in this walkable arts community; condo median prices run around $1,022,500.
Mid-Range Markets: Strong Value Propositions
Mid-Cape and Upper Cape towns offer more accessible entry points with solid appreciation:
| Town | 2025 Median Price | YoY Change | 5-Year Appreciation |
|---|---|---|---|
| Barnstable | $715,000 | +5.9% | +48% |
| Mashpee | $699,000 | +7.5% | +52% |
| Dennis | $685,000 | +4.1% | +45% |
| Yarmouth | $625,000 | +3.8% | +41% |
| Falmouth | $750,000 | +5.2% | +55% |
These markets offer a balance of affordability, rental potential, and appreciation. Mashpee's 7.5% gain reflects growing interest in its golf communities and proximity to New Seabury beaches.
Emerging Investment Areas
Several towns show notable activity shifts suggesting investment opportunity:
- Brewster: New listings up 22.2%, closed sales up 17.2% in 2025
- Eastham: Closed sales up 21.0% despite 30.1% fewer new listings
- Mashpee: Homes for sale up 24.1% year-over-year
Eastham's strong sales despite limited inventory demonstrates exceptional demand for its Cape Cod National Seashore proximity and relatively lower price point compared to neighboring Outer Cape towns.
Rental Income Potential
Cape Cod's rental market offers substantial income potential for investment property owners, particularly through short-term vacation rentals.
Vacation Rental Market Overview
The Cape and Islands vacation rental market shows continued strength:
- 2025 Bookings: Up 5% from 2024, 1.2% above 2023
- May 2025 Traffic: Up 18% year-over-year
- Peak Season Occupancy: 42-47% depending on town
- Off-Season Strategy: Rates often 50% below peak summer weeks
Initial asking rates for 2025 were just 1% higher than 2024, indicating market stabilization after several years of significant increases. However, strong demand continues to support healthy rental income.
Town-by-Town Rental Performance
Based on Airbnb and VRBO data from qualified listings, Cape Cod towns demonstrate varying rental potential:
| Town | Avg Annual Revenue | Occupancy Rate | Avg Daily Rate | Gross Yield |
|---|---|---|---|---|
| Harwich | $109,621 | 39% | - | 10.9% |
| Eastham | $105,454 | 44% | - | 9.4% |
| Mashpee | $109,256 | 32% | - | 9.0% |
| Brewster | $96,420 | 43% | 7.8% | |
| Provincetown | $112,632 | 45% | - | 6.3% |
| Chatham | $163,246 | 42% | - | 6.3% |
| Wellfleet | $91,554 | 47% | - | 6.3% |
Harwich leads in gross yield at 10.9%, making it particularly attractive for investors prioritizing cash flow. Higher-priced markets like Chatham and Provincetown generate more absolute revenue but lower yields relative to purchase price.
Seasonal Considerations
Understanding Cape Cod's seasonal rental patterns is crucial for projecting income:
Peak Season (July-August)
- Highest demand and rates
- Late July through mid-August most competitive
- Many properties book months in advance
Shoulder Season (May-June, September-October)
- Lower rates but ideal weather
- Smaller homes rent better than large properties
- Consider 50% rate reduction from peak
Off-Season (November-April)
- Limited demand except holidays
- Year-round rentals provide steady income alternative
- Some investors convert to monthly rentals
Rental Income Projections by Property Type
Based on market data, estimated annual rental income by property configuration:
| Property Type | Peak Weekly Rate | Annual Revenue Est. | Target Occupancy |
|---|---|---|---|
| 2BR Condo | $2,000-3,500 | $35,000-55,000 | 35-40% |
| 3BR House | $3,500-5,500 | $55,000-85,000 | 38-45% |
| 4BR House | $5,000-8,000 | $75,000-110,000 | 40-47% |
| Waterfront 4BR+ | $8,000-15,000 | $100,000-160,000 | 42-50% |
These projections assume professional management, quality furnishings, and strategic pricing across seasons.
Pros and Cons of Cape Cod Investment
Investment Advantages
Strong Appreciation History Cape Cod has delivered 9.3% compound annual appreciation over six years, outperforming national averages. Geographic constraints and regulatory limitations ensure continued supply scarcity.
Robust Rental Demand Approximately 3 million visitors annually create sustained vacation rental demand. The Cape's reputation as a premier New England destination supports premium pricing.
Tax Advantages Property tax rates averaging $6.54 per $1,000 of assessed value are significantly below the Massachusetts state average of $12.87. This creates meaningful savings for investors.
Lifestyle Asset Investment properties can serve dual purposes: generating rental income while providing personal vacation use during shoulder seasons.
Market Stability Cape Cod attracts affluent buyers less sensitive to interest rate fluctuations. The market maintained positive appreciation even during economic uncertainty.
Investment Challenges
High Entry Costs With median prices at $739,000 and premium markets exceeding $1 million, substantial capital is required. Financing investment properties typically requires 20-25% down payments.
Seasonal Cash Flow Most rental income concentrates in June through August. Investors must budget for year-round carrying costs against concentrated revenue.
Operating Expenses Coastal properties face higher insurance premiums, maintenance costs, and potential flood-related expenses. Property management fees typically run 15-25% of gross rental income.
Regulatory Environment Some Cape Cod towns have implemented or are considering short-term rental restrictions. Investors must verify local regulations before purchasing.
Competition Year-over-year growth in Airbnb listings ranges from 72% to 160% depending on town, increasing competition for rental bookings.
Best Areas for Investment Properties
Based on analysis of appreciation trends, rental yields, and market dynamics, certain Cape Cod areas stand out for investment potential.
Best for Cash Flow: Harwich
Why Harwich Ranks #1 in Massachusetts for STR Yield
- Gross yield: 10.9% (highest on Cape Cod)
- Average annual revenue: $109,621
- Property values: $1,008,589 median
- Strong tourism from beaches and Cape Cod Baseball League
Harwich offers the optimal balance of property value and rental income, making it ideal for investors prioritizing cash flow.
Best for Appreciation: Outer Cape (Provincetown, Truro, Wellfleet)
Why the Outer Cape Commands Premium Prices
- Provincetown: Unique cultural destination with year-round economy
- Truro: Most exclusive, limited inventory, oceanfront access
- Wellfleet: Artist community, National Seashore proximity
These markets attract affluent buyers willing to pay premium prices for irreplaceable locations. Limited developable land ensures continued appreciation. Learn more about Outer Cape lifestyle in our guide to living on the Outer Cape.
Best for Entry-Level Investment: Eastham
Why Eastham Offers Opportunity
- Average property value: $1,126,294
- Average annual revenue: $105,454
- 44% occupancy rate (highest on Outer Cape)
- Closed sales up 21% despite fewer listings
Eastham provides Outer Cape character at lower price points than Provincetown, Truro, or Wellfleet, with strong rental demand from National Seashore visitors.
Best for Diversification: Barnstable
Why Barnstable Suits Diverse Strategies
- Seven villages with varying price points
- Year-round community reduces seasonal dependency
- Commercial and residential opportunities
- Central location with bridge proximity
Barnstable's diverse villages allow investors to match properties to specific strategies, from Osterville luxury to Hyannis accessibility.
Tax Considerations for Cape Cod Investors
Understanding tax implications is essential for maximizing investment returns.
Property Tax Advantages
Cape Cod property taxes are notably lower than Massachusetts averages:
| Town | Tax Rate per $1,000 | Annual Tax on $1M Home |
|---|---|---|
| Chatham | $3.47 | $3,470 |
| Dennis | $4.33 | $4,330 |
| Provincetown | $5.60 | $5,600 |
| Falmouth | $5.87 | $5,870 |
| Truro | $6.18 | $6,180 |
| Wellfleet | $7.11 | $7,110 |
| Sandwich | $10.57 | $10,570 |
Comparison: Massachusetts state average is $12.87 per $1,000. A $1 million property in Chatham saves $9,400 annually compared to state average rates.
Investment Property Tax Considerations
Rental Income Taxation
- Rental income is taxable at federal and state levels
- Massachusetts state income tax: 5% flat rate
- Deductible expenses include mortgage interest, property taxes, insurance, repairs, depreciation, and management fees
Depreciation Benefits
- Residential rental properties depreciate over 27.5 years
- Depreciation provides non-cash deduction reducing taxable income
- Example: $1M property (land excluded) provides approximately $29,000 annual depreciation deduction
1031 Exchange Opportunities
- Investment properties qualify for tax-deferred exchanges
- Allows reinvestment of gains without immediate tax liability
- Useful for portfolio repositioning between Cape Cod markets
Estate Planning Considerations
Massachusetts estate tax applies to estates exceeding $2 million, with rates from 10% to 16%. For substantial Cape Cod property holdings, strategies to consider include:
- Irrevocable life insurance trusts
- Qualified personal residence trusts
- Family limited partnerships
- Homestead declaration (protects up to $1 million in equity)
Consult with a qualified tax professional for personalized guidance on your investment structure.
Potential Transfer Tax Changes
Cape Cod is considering a 2% real estate transfer fee on luxury home sales above $2 million to fund affordable housing initiatives. Investors in premium markets should monitor this development as it could affect transaction costs.
Investment Strategy Recommendations
For First-Time Cape Cod Investors
Target Market: Harwich, Eastham, or Brewster Property Type: 3-bedroom single-family home Budget Range: $700,000-$1,000,000 Strategy: Maximize vacation rental income during peak season, use personally during shoulder season
This approach balances cash flow potential with manageable entry costs while building Cape Cod market knowledge.
For Cash Flow Maximization
Target Market: Harwich or Mashpee Property Type: 4+ bedroom home near beaches Budget Range: $1,000,000-$1,500,000 Strategy: Professional management, aggressive marketing, multi-platform listing
Prioritize properties with pools, water views, or beach proximity that command premium rental rates.
For Long-Term Appreciation
Target Market: Outer Cape (Provincetown, Truro, Wellfleet) Property Type: Waterfront or water-view property Budget Range: $1,500,000+ Strategy: Moderate rental activity, focus on property appreciation and lifestyle use
Accept lower yields in exchange for premium appreciation potential and irreplaceable location.
For Portfolio Diversification
Target Market: Mixed Barnstable villages Property Type: Combination of price points Budget Range: Varies Strategy: Spread risk across property types and locations
Build a portfolio that balances cash flow properties with appreciation-focused holdings.
Frequently Asked Questions
Is Cape Cod a good investment in 2026?
Cape Cod real estate fundamentals remain strong entering 2026. With 70% appreciation over six years, below-average property taxes, and robust rental demand, the Cape offers compelling investment characteristics. However, high entry costs and seasonal income patterns require careful financial planning.
What is the average ROI on Cape Cod investment property?
Based on 2025 data, gross rental yields range from 4.9% (Nantucket) to 10.9% (Harwich) on Cape Cod. After accounting for operating expenses (typically 35-45% of gross revenue), net yields generally fall between 4-7%. Appreciation has averaged 9.3% annually over six years, contributing significantly to total returns.
Which Cape Cod town is best for rental income?
Harwich leads Cape Cod with a 10.9% gross yield, followed by East Falmouth (9.6%) and Eastham (9.4%). These towns offer the optimal balance of property values and rental income potential.
How much can I make renting a Cape Cod property?
Annual rental revenue varies by property: 2-bedroom condos typically generate $35,000-55,000, 3-bedroom homes $55,000-85,000, and 4+ bedroom homes $75,000-160,000 depending on location, amenities, and waterfront access.
Are Cape Cod property taxes high?
No. Cape Cod property taxes average $6.54 per $1,000 of assessed value, nearly 50% below the Massachusetts state average of $12.87. Chatham offers the lowest rate at $3.47 per $1,000.
What are the risks of investing in Cape Cod?
Key risks include seasonal income concentration, high operating costs, increasing competition from new vacation rental listings, potential regulatory changes affecting short-term rentals, and climate-related insurance costs for coastal properties.
Next Steps for Cape Cod Investors
Cape Cod real estate investment offers compelling fundamentals: strong appreciation history, robust rental demand, favorable tax treatment, and the lifestyle benefits of owning property in one of America's premier coastal destinations.
Success requires understanding market nuances, selecting appropriate towns and property types for your goals, and partnering with experienced local professionals who can identify opportunities and navigate transactions.
Ready to explore Cape Cod investment property opportunities? Schedule a consultation to discuss your investment goals, review current market opportunities, and develop a strategy aligned with your objectives.
For additional market insights, visit our market reports for the latest data, explore recently sold properties to understand comparable values, or learn more about specific neighborhoods across Cape Cod.
Considering waterfront property? Our guide covers what to know before buying coastal real estate, including flood zone considerations and insurance requirements.